

A fifth grade blog! Interested in my blog when I taught Kindergarten? Here it is: https://kindersthelen.blogspot.com/
Wednesday, November 30, 2016
What is matter?
Students have started exploring "What is matter?" They started the investigation by thinking about the different ways that we define matter.
Then, they sorted picture cards into categories of Matter/Not Matter. Some pictures that students were unsure of were: sound, heat, light and air.

Next, students will use a variety of materials to test a question that will help them determine some of the properties of matter.
In each "tub" they are testing light, air, sand, stones, and water.

Each tub has a different question, such as, "Can you pour it?" or "Does it have mass?"


It has been amazing to see students refine their thinking after only three days of this first learning cycle.


Want to learn more about this exciting program? Click Here to find out more!
Picture book project
Students began our picture book project that will focus on a service project for our school while practicing fluency, reading with accuracy and expression.
Students had to review three different picture books and choose a text that was a "just right" fit. We are going to make a playlist of "holiday books", "bedtime books", and "old favorites" to share with our K-2 students at Paxton Keeley.
Students had to practice reading the book silently to self and then out loud to self.

Students then have to read the text to two other students. They are expected to use the right pacing and practice "reading like a teacher" with expression.

Students will import the images of the book into iMovie and record their voice over the text to create an "audiobook" with images.

Students will be read their selection to me before it goes public.

When we are finished, they will be uploaded and QR codes will be created for each playlist. Then, the codes will be copied to a "bookmark" that will be distributed to our K-2 students in the Friday Folders.


At the end of our project, students uploaded their projects into Google Drive. A QR code was made for the books and we distributed the codes to our students and teachers in grades K-2.


Tuesday, November 29, 2016
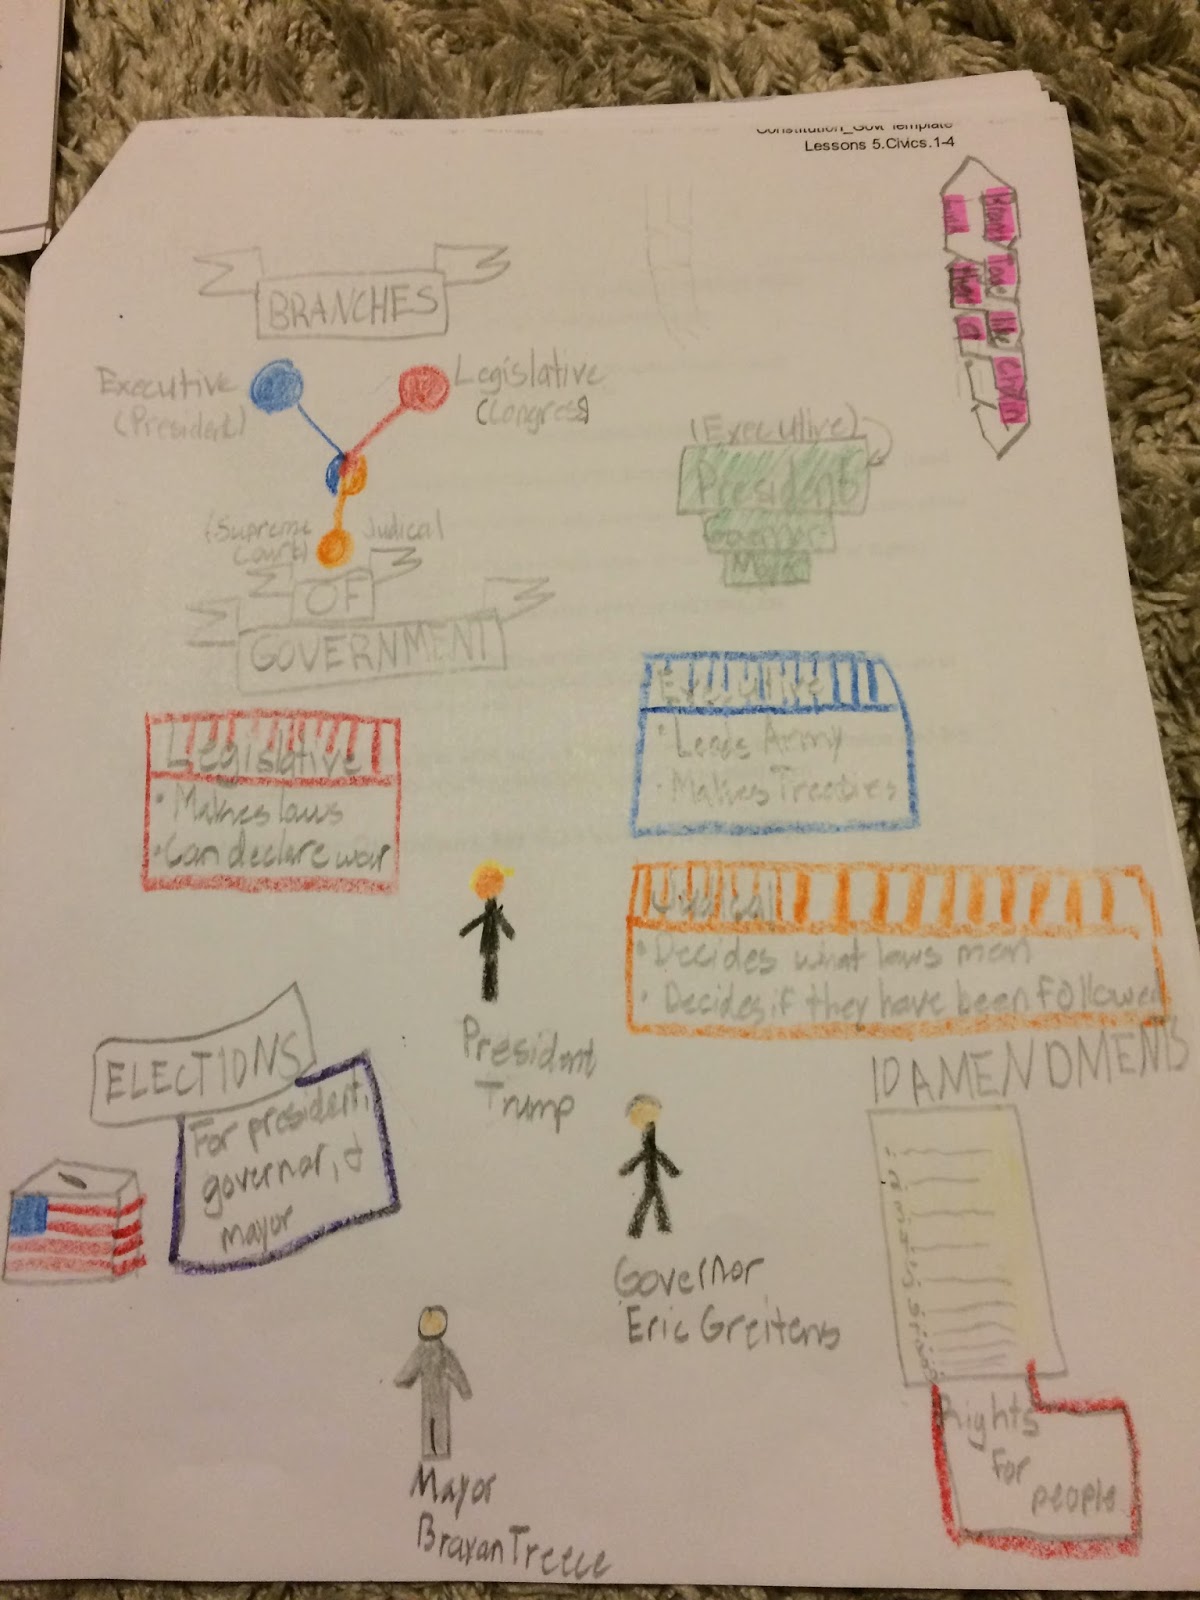
Using Sketchnotes to communicate the big ideas on Government
Sketchnotes are rich visual notes created from a mix of handwriting, drawings, hand-drawn typography, shapes, and visual elements like arrows, boxes, and lines (definition from Mike Rohde, The Sketchnote Handbook).
Students summarized their notes on our government and the constitution by using a Sketchnote. Here are some examples:


Click here if you would like to see other examples of how Sketchnotes can be used in the classroom and its benefits:
http://www.simplek12.com/brightsparktravel/sketchnotes-in-the-classroom/
Click here if you would like to learn more about the connection with learning through visuals https://www.psychologytoday.com/blog/get-psyched/201207/learning-through-visuals
Students summarized their notes on our government and the constitution by using a Sketchnote. Here are some examples:


You can click on the images to get a better look at them.
Click here if you would like to see other examples of how Sketchnotes can be used in the classroom and its benefits:
http://www.simplek12.com/brightsparktravel/sketchnotes-in-the-classroom/
Click here if you would like to learn more about the connection with learning through visuals https://www.psychologytoday.com/blog/get-psyched/201207/learning-through-visuals
Staircase problem day two
Students were presented with another staircase problem. This time, their task was to determine how many sides are present based on the number of stairs. Students created an input/output table showing the function.

Students used craft sticks to build the staircase, counting the sides as they went.


As the students approached ten, they realized that it was pretty hard.A lot is going on here, but there are a few takeaways.
1. For the most part, students agreed on the outcomes for terms 1-5.
2. Students started to see a pattern emerge.
3. When students "jumped" from 5 to 10, the output for ten was varied. Some students thought that they could use what they knew about the fifth term to help them determine the tenth term. Another student pointed out that if we look at the second and fourth term's outputs, they are not just "doubling" them.
4. A student noticed the terms were all factors of its corresponding output. This led to another pattern... 1X4=5, 2X5=10, 3X6=18, etc...
5. Students recognized that if we could figure out an expression or a rule, we could easily compute the 100th term without having to build with the sticks or making a really elaborate table.

We will keep thinking on how we can create a rule, using an expression, to help us compute with greater values.
Monday, November 28, 2016
Introducing variables and expressions
Students were introduced to a series of "staircases". You can find detailed ideas on how to use in the classroom, across multiple grade levels, here . You can tell that I am an exceptional artist when it comes to representing something in 3-D.
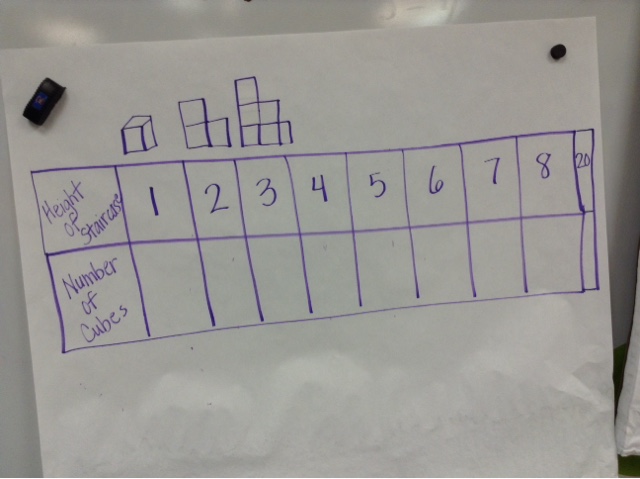
Students went to work. They recorded the height of the staircase and the number of cubes that matched each term. While most students used cubes, many were able to establish some sort of pattern pretty quickly and abandoned the cubes.


It is hard to see here but a student is trying to draft an expression in word form.

Another student suggests that we try using a variable to express the pattern. We tried using one for n but it was not quite something that worked when n changed.

I introduced how we can use a variable, or a letter, preferably n to help us communicate an expression. The wheels were turning. We shared our ideas as a class and tested them out.
A few students were beginning to make connections as to how this could be represented and that it might take more than one operation to do so. The investigation will continue!

Please note, the learning target was purposefully absent. I have moments where I think it is helpful and can support student understanding. However there are times that I think it blows the whole inquiry down the drain. Want to consider another perspective? Read this blog post here: Joe Bower's Blog

Creating a graph
Students used data that showed that average hours of daylight in Columbia, Mo on the 15th of each month for a year.

Students labeled their graphs with the title and the x and y-axis.


We used a bar graph to represent the data so we could visually see the patterns emerge over time.


While students were able to predict what their graph looked like before constructing it, this provided us with a good opportunity to talk about the process of setting up a graph and determining which kind of graph would be beneficial for our purpose.
Saturday, November 19, 2016


Space systems wrap up


Students worked to show their thinking of what they have learned during this unit on Space Systems. There are some projects that reveal that we still have some misconceptions or that translating the concept into a 3-D model is harder than we thought!
Here are some student examples:
Tuesday, November 15, 2016
Exploring Stop Motion
Students are exploring the application Stop Motion, which is basically an app to animate using time-lapse photography. Students have worked to fine tune the technical side of the app through play and exploration. They are teaching each other tricks they have discovered along the way as well as utilizing tips from technical tutorials. Why? So they can explore science content and focus on the science content-- not the tech!
Soon, students will be using the app to show what they have learned about our unit on Space Systems. They can choose to demonstrate the moon phases and its patterns or how the earth revolves and rotates-- among other big ideas. In any case, teaching someone else sure keeps you on your game for not only refining one's understanding of content and vocabulary but also communicating those ideas effectively!


Subscribe to:
Posts (Atom)