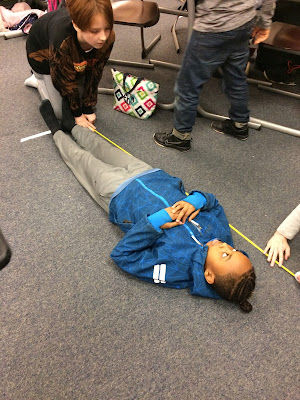
Students collect a data set to create a line plot graph. Students measured their height in inches. Our range of height was 54 inches- 64 inches.
Students found the volume of the Willis Tower in Chicago. Using a "model" of the towers. We discovered that there were nine towers. Then, using some data provided, students were challenged with finding the approximate volume of the towers. A great challenging problem!
Our first round of computation. Back to the drawing board!


